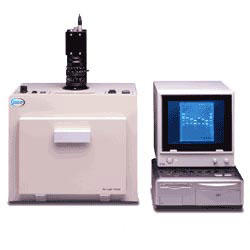
A. Features
   1. This is the unit to read and take a photo of the fluorescent sample band by CCD Camera.
   2. It can print the data and keep as a digital data for separation, image
      analysis and documentation of DNA, RNA and protein.
   3. The high resolution unit allows visualization of bands.

B. Configuration
   1. Gel Documentation System
   2. Multi Analysis Software
   3. Digital thermal Video printer
   4. Data Processing System ( optional )

C. SpecificationsI. UV Fluorescent Gel Documentation System
   (1) UV Transilluminator
       1) Compact darkroom
       2) Small footprint
       3) Large door
       4) UV safety switch
       5) Epi-White light illumination for opaque sample

   (2) CCD Camera and zoom lens assembly
       1) CCD Camera : 1/2 inch, 41 ten thousand dot density integrating
          camera with 6X zoom lens attached
       2) Exposure time setting ( 1/30 ~ 30 sec )
       3) Sensitivity : EtBr stained : 0.1 ng of DNA, SYBR Green stained : 0.01ng of DNA
       4) Filter changing for different sample type
       5) Automatic camera focus, zoom, iris
   (3) Fluorescent UV bandpass filter and IR blocking

   (4) Digitizing functions
       1) Accepts several imaging signals from CCD
       2) Allows image displays with all computer monitor resolution.

   (5) Integration cable
       1) Supply image display and integration to the PC monitor directly
       2) Video input connector and integration control connector

   (6) 1-D Analysis Software
       1) Easy, fast and full automatic optimization and accurate quantitation
          of images obtained from the unit.
       2) A general-purpose image analysis program designed to assist life science
	       researchers in the study of 1-D electrophoretic separations,dot blot, slot lot,
		   microplate, TLC, and plaque assays.
 II. Technical Specifications
    1) CCD Camera
       - Camera resolution : 768 x 494 pixels
       - Integration : 1/30 ~ 30 sec
       - DNA resolution : 0.1ng or 0.01 ng
       - Signal to noise : 56db
       - Zoom lens : 6X , F1.0 ~ 16c
       - Imaging area : 210(W) x 150(D),mm
    2) Hardware
       - Darkroom Hood
       - Inverter type Transilluminator (safety time : approx. 20sec)
    3) Software
       - Acquisition software : Windows NT, Windows 95,98 , Mac
       - Analysis software : included
       - UV/White
       - Data : 8 bit
       - File size : 350kB
    4) Transilluminator
       - Sample size : 210 (W)x 150(D),mm
       - Illumination : UV 312 nm, 6W x 8each
       - Intensity : approx. 3mW/cm

III. Multi Analysis Software
     1) Enhancement analysis - rightness, contrast, gamma, sharpen, emboss,
        starfield correction and optimize
     2) View and capture of images
     3) Automatic integrating time
     4) Video printing, annotation function in the acquisition window
     5) Image zooming and dot blot, area density function
     6) Pixel resolution : 41 ten thousand dot density
     7) Precise analysis over 256 gradation gray levels
     8) RFLP, RAPD analysis : Dendrogarm Creation Function
     9) Colony or object counting capability
        (automatic set-up mode : vol, %, labelling, 2 colors , etc )
    10) Microtiter plates dot blot analysis
    11) Image rotation ( 90,180,270 degree)
    12) Quantitative analysis by specific area and complemetanry baseline
        - Input standard value
        - Color -coded report
        - Changing ( percentage ) report
        - Set-up report window of display items
        - Division by Valley to Valley
    13) Estimating molecular weight for Electrophoresis, etc
        - Display in the lanes in line
        - Increase or decrease an analysis object band
        - Diplay dialog, color-coded data of each band
        - Graphic of standard curve change a logarithm graph
        - Freely set-up a quadrature coordinate axis.
        - Auto-changing Electrophoresis mobility
   14) Densitograph in vertical and horizontal direction
   15) The part enlarging image
   16) Reversing image light-up degree and mirror
   17) Writing characters arrows ( text, change a font size, display color
       format, boldness, color of an arrow, etc )
   18) Image data adding file
   19) Superposing image
   20) Highly sensitizing : binning of 2x2, 3x3
   21) TIFF format
   22) Numerical value each band
   23) Precise analysis 65536( 16bit)gray labelsD. Accessories

1. Digital Thermal Video Printer -------- 1 set
   - Printing method : thermal printing on thermal sensitive paper
   - Image size : 13 x 10 cm
   - Clear grade : 260 dpi
   - Gray scale label : 256 gradation
   - Printing time : 4.5 sec
   - Power : 110VAC, 50/60Hz, 100W
2. Data Processing System ( optional ) --------        1 set
   - Computer -------- 1 set
   - Printer ------- 1 set

E. Remarks
   1. Warranty : one year
   2. Installation and training shall be provided by skilled engineer at user.
|